 Today, we released significant enhancements to our COVID-19 dashboard.
The new dashboard includes a number of improvements:
- Larger graphics, with the ability to drill down through filtering some of the data at a more granular level.
- Information about hospitalizations and deaths, as well as information about hospitalized cases in Arizona.
- Case counts broken down by zip code with the ability to download the zip code data.
- More detailed demographic information about cases and deaths in our state.
We’ve also improved the user interface and navigation. The dashboard includes three sections:
- Overview
- Current Trends
- Key Healthcare Metrics
Each section can be accessed through the drop-down menu at the top of the dashboard. To access the different data points, you can either scroll down each page or choose the specific button across the top to jump directly to that section.
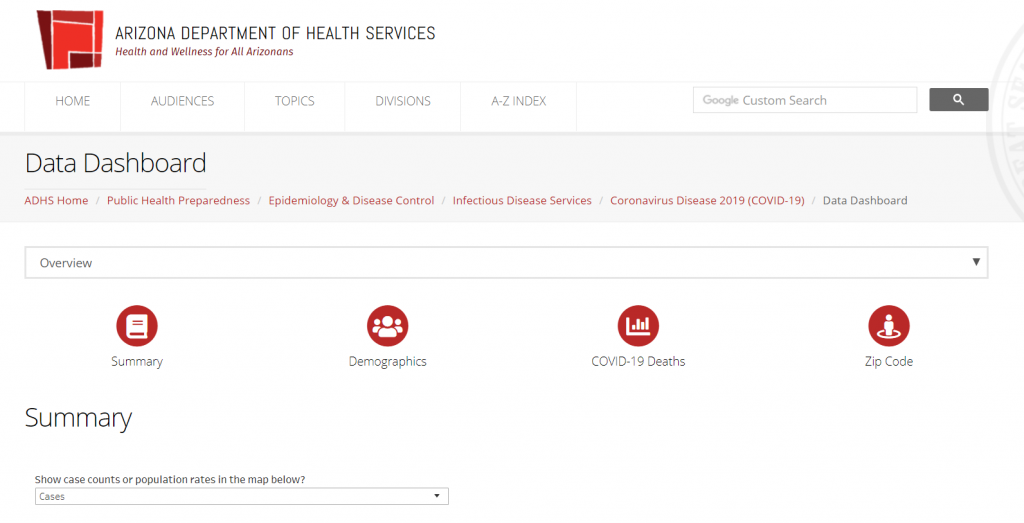
COVID-19 Overview
Dashboard updates to the overview page include buttons that will take you to the major overview sections:
- Summary
- Demographics
- COVID-19 Deaths
- Zip Code Data
We’ve added some new data points into the summary section, including new cases, deaths tests reported that day. You can also select to view the rates of COVID-19 cases by 100,000 population for each of the counties. The demographic section contains new data about confirmed COVID-19 cases and percent of the cases that have chronic medical conditions or are considered high risk for complications. Approximately, 28 percent of individuals were known to have a chronic medical condition and 43% were considered high risk. The actual numbers of people with a chronic medical condition or at high risk are likely much higher, as we might not have the medical history of every case.
A critical note about all of the case data presented is that it only reflects individuals who have tested positive for COVID-19. We know that there are many individuals who were unable to get tested in the community. In addition, we know that people can be infected and spread disease without showing symptoms. While physical distancing is occurring, people do not always remain isolated within their own zip code when conducting essential business. As a reminder, zip code counts include anyone in that zip code who has tested positive, whether their infection occurred two months ago and has resolved or two weeks ago and is still active. Thus, while zip code data is informative, it should not be used to determine whether or not residents of a particular zip code are or are not at risk of COVID-19.
COVID-19 Current Trends
This page covers multiple topics and has a few new sections of data:
- The COVID-19 Cases Confirmed by Day, or “Epi Curve”
- Hospitalizations
- Hospital COVID-like & Influenza-like-illness Surveillance
- Laboratory Testing
- Congregate Settings with Positive COVID-19 Cases
The hospitalization section contains data about our confirmed COVID-19 cases who were hospitalized and their key demographics. The majority of our cases who were admitted to the hospital were over 65 and the largest number of patients hospitalized were in Maricopa and Pima counties. The final section of this page includes information about congregate settings that have had at least one confirmed COVID-19 case. This section can be filtered to see specifics about each county and contains information about the setting types and the number of facilities reporting confirmed cases each week. We have also added the Influenza-like-illness surveillance to our syndromic surveillance section. This can be accessed by choosing the tab at the top of that section. In public health, we use this data to monitor the impacts that COVID-19 and influenza are having on our hospitals. This will become especially important as we move into the next flu season.
Key Healthcare Metrics
This section provides key metrics of our hospitals in Arizona, which the state is now collecting as a result of enhanced surveillance advisories ordered by Governor Ducey to allow public health to better track the health of our healthcare system. This section includes:
- Hospital Bed Usage & Availability
- Ventilator Usage & Availability
- Hospital COVID-19 Specific Metrics
This data provides details about the capacity and current utilization of emergency room beds, inpatient beds, ICU beds, and ventilators in hospitals throughout Arizona. You can switch between the different bed types by selecting the tab at the top of that section. This data indicates that currently, there is capacity within our healthcare system to handle an increase in COVID-19 hospitalizations.
In the Hospital COVID-19 Specific Metrics section, please note that the data included in the COVID-19 Discharge tab includes an increase on 4/17, as a result of additional reporting from a hospital system that had not previously reported this information. The information reported indicates daily discharges, and is not cumulative,
Stay Tuned
While it appears that our mitigation strategies are working, we urge everyone to remain vigilant and continue to follow Governor Ducey’s “Stay Home. Stay Healthy. Stay Connected” order. We will continue to share additional data and are working on building out more data points. Staying physically distanced while also taking recommended prevention measures — wash your hands, avoid touching your face, stay home if you are unwell, consider wearing a cloth face covering when you cannot appropriately physically distance — can help us continue to slow the spread of COVID-19 in our communities. For the latest information about the Arizona response to COVID-19, please visit our website.


Social Media